Northern Anchovy
Engraulis mordax

Northern Anchovy
Engraulis mordax
Northern anchovy populations have a boom-and-bust population cycle, and at present they have no immediate overharvest threat.
Morphology
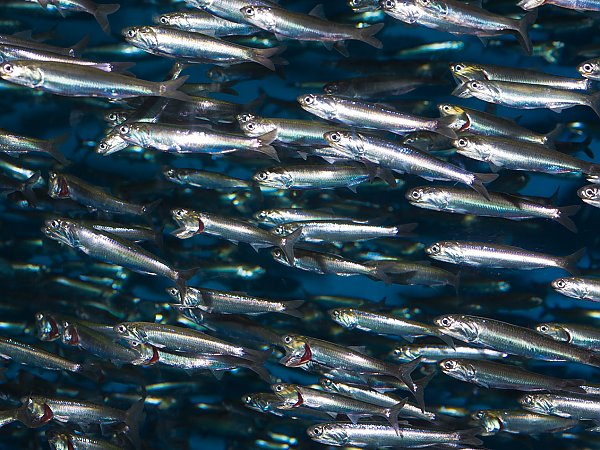
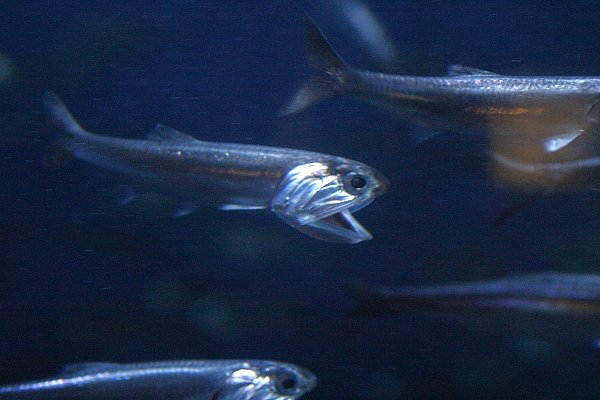
Northern anchovies are bluish green on the back and silvery on the belly, with a faint silver stripe along their sides. They have long snouts and large mouths and primarily feed on plankton. They employ two feeding methods: filter feeding using their gill rakers to capture plankton and particulate feeding by seizing larger prey with a quick bite.
Habitat and Range
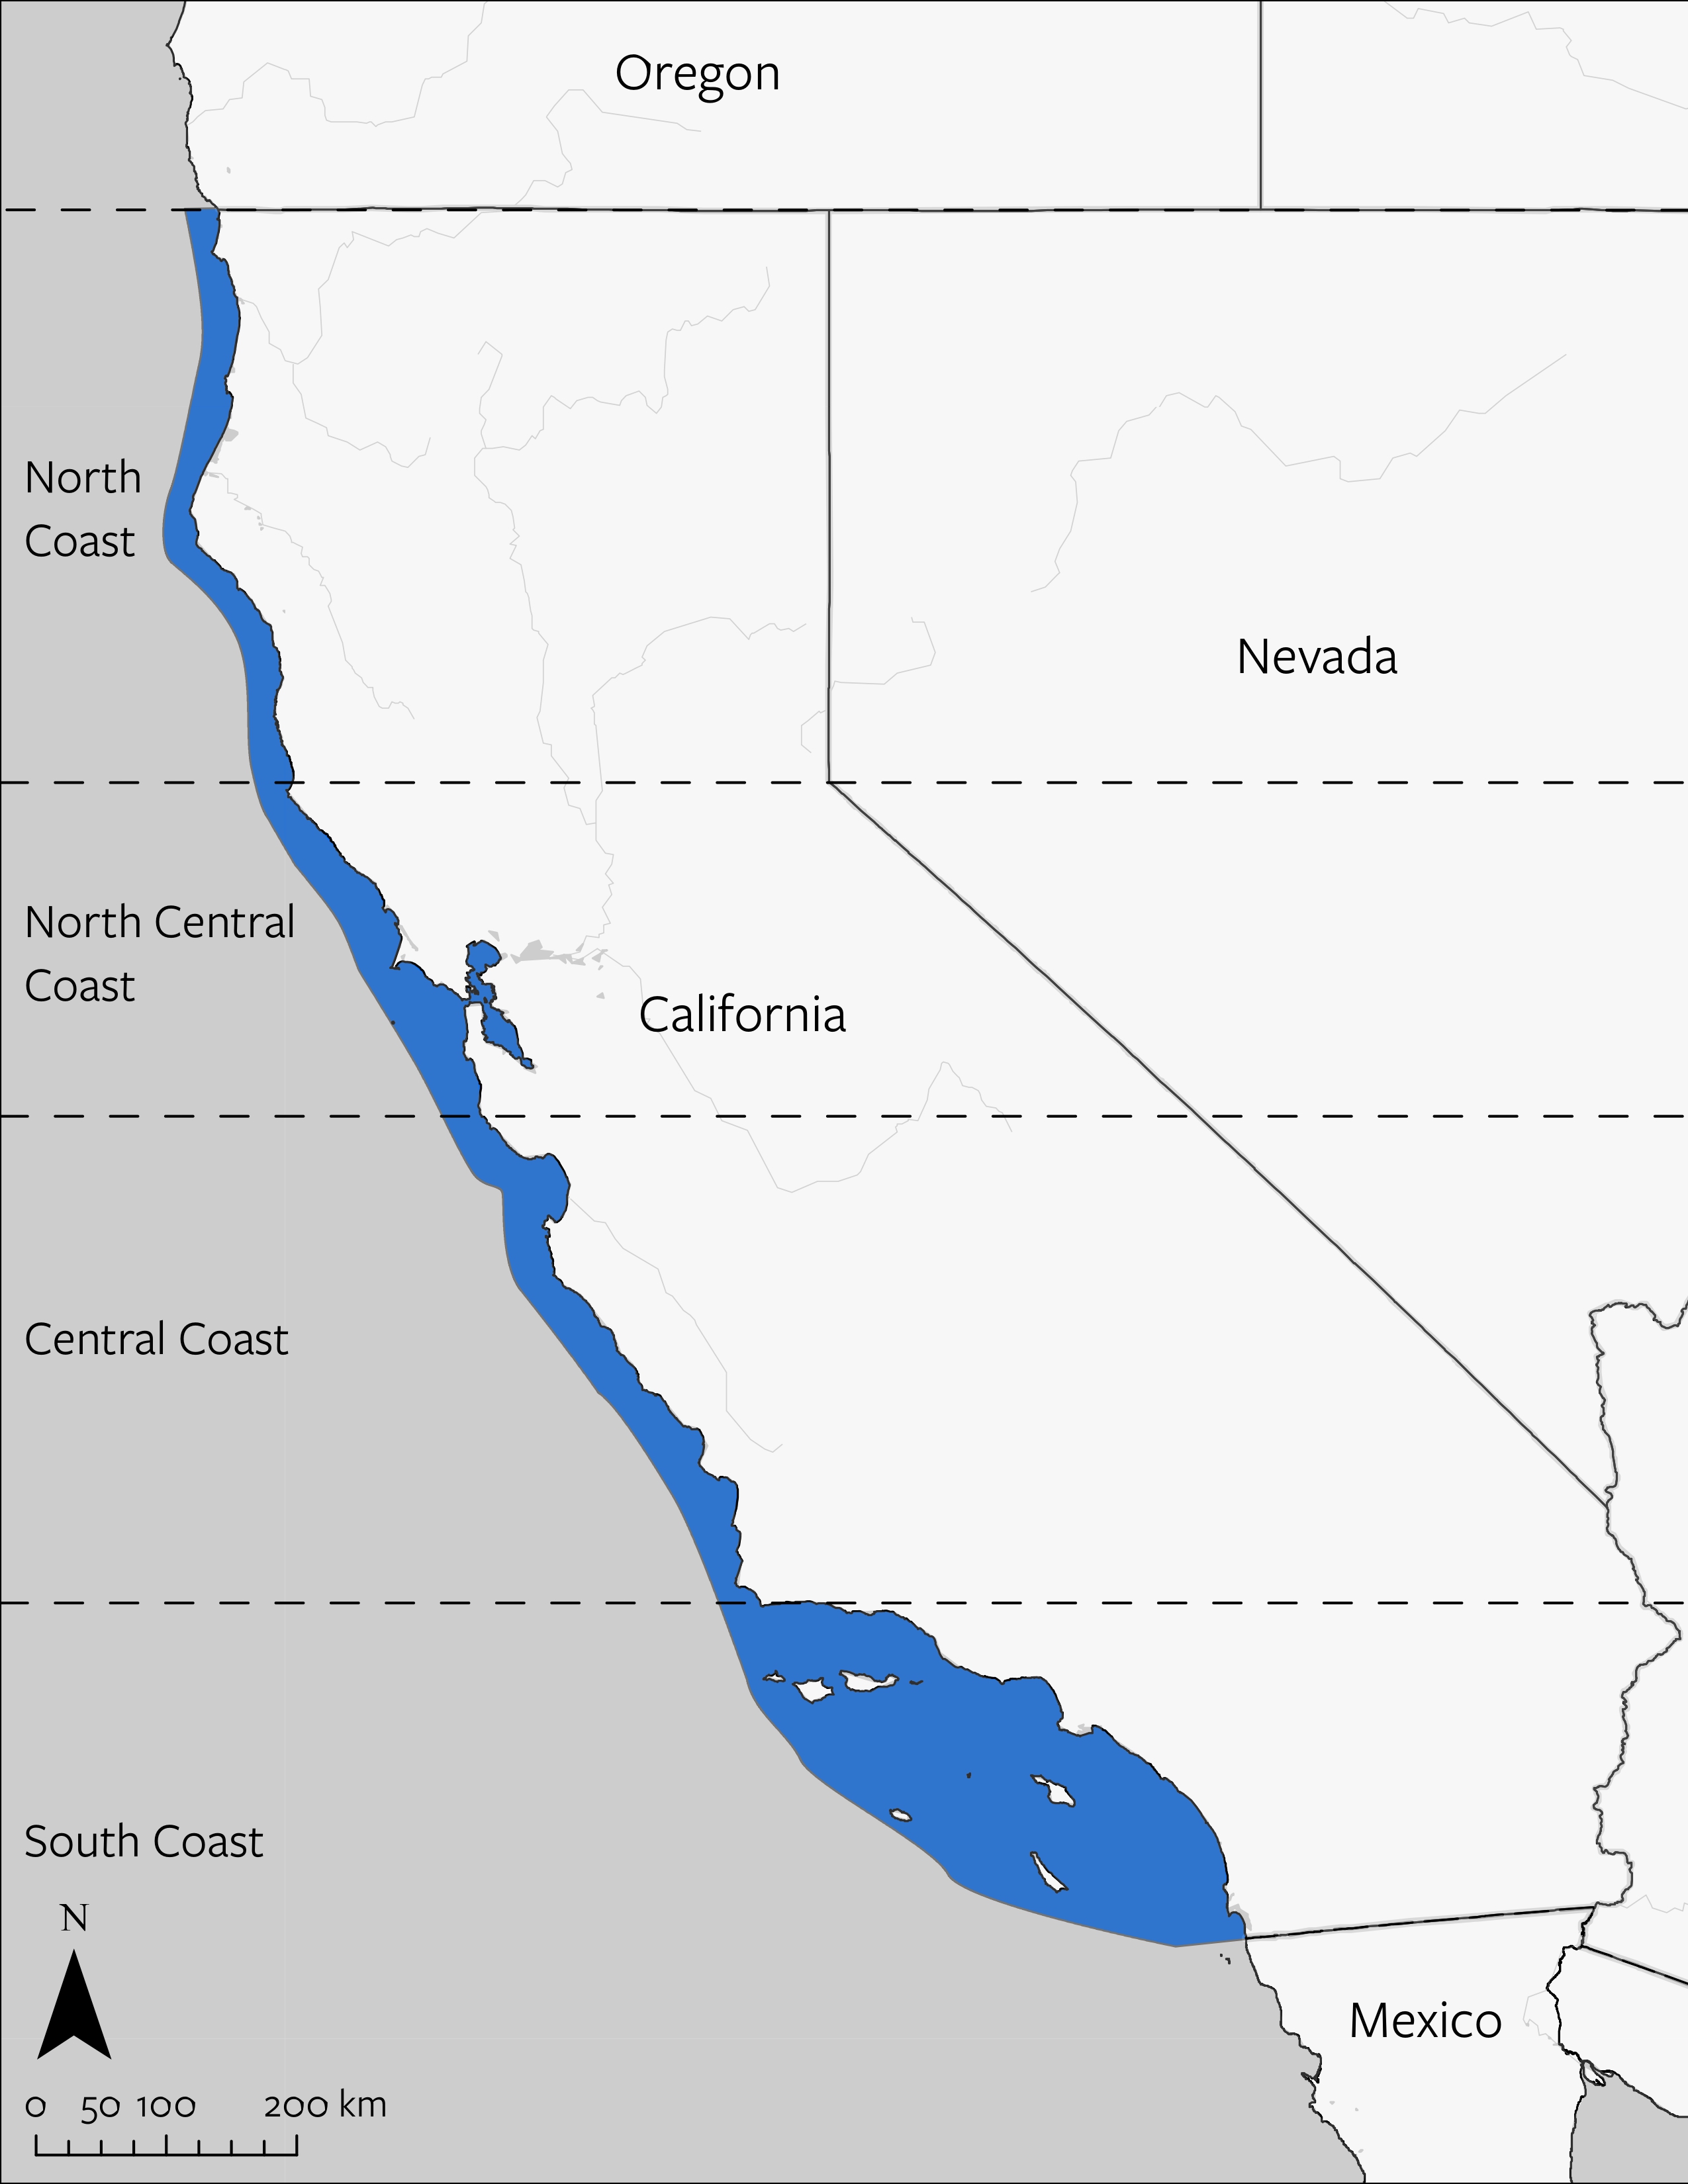
Northern anchovies inhabit coastal pelagic zones, typically within 30 kilometers of the shore. They are found in the epipelagic (or “sunlight”) zone, with larvae residing from zero to 50 meters deep and adults between 70 and 200 meters deep. They prefer water temperatures between 8°C and 25°C and are often associated with areas of coastal upwelling.
Range Map
Reproductive Biology and Life History
They grow quickly, reaching up to 18 centimeters in length at maturity. Most northern anchovies live between 4 and 7 years, with an average lifespan of about 5 years. Northern anchovies are broadcast spawners, releasing eggs in batches every 7 to 10 days. Spawning occurs throughout the year, peaking from February to April. Eggs hatch within 2 to 4 days, depending on the water temperature. They reach sexual maturity at about 2 years of age. Northern anchovies are promiscuous, with both sexes spawning indiscriminately with multiple partners during the breeding season. Their ability to spawn frequently and produce large numbers of offspring allows them to respond quickly to favorable environmental conditions, which may only last for a short period of time.
Ecology
Northern anchovies are considered keystone species in the California Current Ecosystem (CCE) because they are prey for over 60 species of commercially or recreationally valuable predators. They can comprise up to 90% of the diets for some notable marine species such as Chinook salmon and humpback whales. The populations of northern anchovy and Pacific sardine can be affected by climate patterns in the Pacific Ocean, particularly:
- The Pacific Decadal Oscillation (PDO), which cycles over 20-30 year periods
- El Niño Southern Oscillation (ENSO), which cycles over 2-7 year periods
These climate cycles drive changes in ocean temperatures and primary productivity that may impact anchovy and sardine populations in contrasting ways. Until recently, the consensus has been that warmer water favors sardines and cooler water favors anchovies. Contrary to this conventional view, northern anchovy experienced very high recruitment during the 2014 to 2016 marine heat wave. This high anchovy recruitment during the recent heat wave has led some biologists to suggest we may be observing a regime shift, whereby historical sardine-anchovy relationships are fundamentally altered.
Cultural and Historical Context
The commercial fishery for Northern anchovies launched in the early 1900s and expanded in the 1940s and 1950s when the sardine fishery was collapsing. Anchovies are harvested for three purposes: direct consumption by humans, as live bait, and to be processed into feed for poultry and livestock. The commercial catch of anchovies in California peaked in the 1970s at over 130,000 metric tons but has now declined to less than 5000 metric tons since 2020. The decline in commercial landings is largely due to lower demand and reduced prices paid to fishers.
Date modified: January 2025
Primary ThreatsPrimary Threats Conditions
Threats and Conservation Status
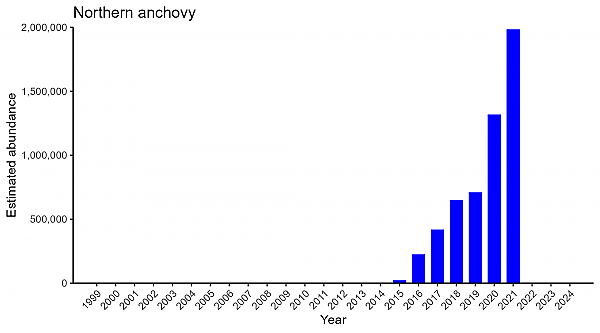
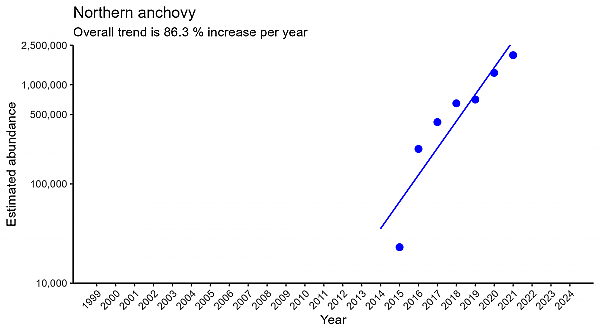
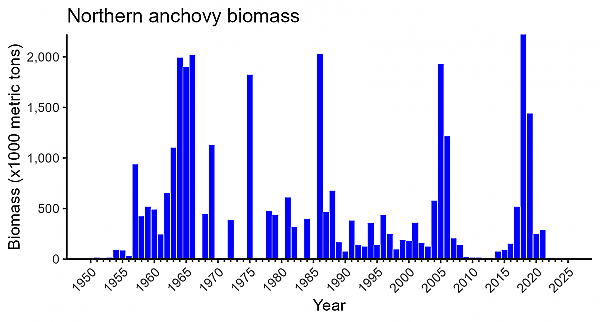
In recent years the California anchovy population has been increasing at a rate of 86% per year, as is evident in the graph of their populations from 2015 onward. However, this recent increase in anchovies has to be viewed in the context of a long history of boom-and-bust population dynamics as is evident in the graph of biomass from 1950 up through 2022.
Anchovy population dynamics are influenced by interactions with dozens of species, by upwelling, by cycles in ocean conditions, and by variable harvest. Climate change has the capacity to alter all of these relationships—which adds additional uncertainty. Even with over seventy years of population data, we lack the ability to model and predict anchovy population fluctuations. Given this complexity, some biologists have suggested the species would be best managed via a fixed two-state harvest control rule. The key idea here is that when the population is in a “high abundance state” commercial fishing could be allowed, and when the population is in a “low abundance state,” only experimental fisheries would be allowed.
Currently there is no immediate overharvesting threat to Northern anchovies and hence no need for active management. This situation exists because of limited market and no processing capacity for these fish in California. In lieu of active management, Northern anchovy is in the monitored category, with some debate about how frequently stock assessments should be performed for the species. While in the monitored category the default regulation is that catch limits are set to 25,000 metric tons, but catch has not approached that limit in any years of monitoring.
Population Plots
Data Source: The Northern anchovy assessment is of the central subpopulation. The assumed distribution is from about San Francisco Bay down to central Baja California. See Table 12 (page 34) of the assessment document https://repository.library.noaa.gov/view/noaa/45013